GfK Mystery Shopping
Reporting
GfK Mystery Shopping recognizes the vast amount of information that our clients are confronted with every day, and we help avoid information overload. We enable you to concentrate on monitoring only those behaviors that are the key drivers to improving your service delivery performance. Our custom reporting systems (click here for an example) are designed to meet the unique needs of management in 3 areas:
Front-line
Staff
|
Highly graphic ‘user-friendly’ reporting, clearly identifying key areas for improvement in an easy to digest format.
|
Field
Management
|
Fast, custom-built on-line reporting system designed to provide a full understanding of comparative results in "real time", at the touch of a button, across all levels of your hierarchy.
|
Corporate
Management
|
For the Executive team—insight, a nalysis and recommendations in the form of executive summaries and PowerPoint presentations and analysis. We also offer a powerful management decision-making tool, MShop+, our proprietary model for integrating Mystery Shopping data with other data streams including customer satisfaction results.
|
Store Reports—front line staff
Each store is sent a detailed, highly graphic report in color, allowing the results to be displayed in the store, and allowing a user to quickly understand the findings and implications of each shop. This report will contain information about the shop assignment, including areas of strengths and weaknesses, together with targeted actions and comparisons to their performance in previous waves. The target audience for this report is the store manager who would then disseminate to their team.
The shop report is often available on a password protected Web site, or can be sent via e-mail.
Every program has a unique set of requirements and GfK Mystery Shopping works with each of our clients to design a custom report that will be most effective for them. The following pages contain some examples of what we can do for you. The first page of the shop will often provide an overview of the assignment, including the visit details, the scenario and the overall performance on each of the key measurement areas. This is done in a graphic format. While the report below shows GfK Mystery Shopping, the graphics used are custom designed for each client.
The store’s results are often compared to the results of other stores in the local district or region and perhaps nationally. In a similar way, results can be compared to previous waves. Highlights of the positive and negative results of the shop are also often shared, along with a space for the store to create an action plan.
Of course, the result details of the entire shop are also included in each report.
Quality Assurance Editors
GfK Quality Assurance editors are trained to review each shop report after the shopper has entered the information. All reports are reviewed before receiving final approval to be published. The editors review each report for accuracy and completeness, for proper grammar, and investigate anything that requires further explanation.
While timeliness of the reporting is critical, it is also extremely important to send out a report that is accurate and complete. Our editors operate under one overriding instruction—“if it’s not 100% correct, don’t send it!”
back to top
Field Management and Corporate Reports
GfK typically recommends delivering all results on a secure, password protected web site. The aim is to create a web site to drive service delivery improvement within your organization. While the results of the mystery shopping form an integral part of the site, a successful system will also include or have links to all the information staff require to improve their performance.
Regional Managers have access to each of the individual reports above, but will also have access to customized, dynamic summary reports that will help identify ‘big picture’ issues more readily.
Each Manager can log into the Web site and access a report summarizing the performance of each of their stores, compared to their region and perhaps national results. Areas of weakness and how to improve them are highlighted, along with positive achievements. These reports include cumulative store scores, actions, benchmarking against division and regional ranking.
A reporting web site can add value to reporting at all levels. For this reason GfK suggests, wherever possible, letting all staff involved in the program have access to on-line reporting, from Corporate Office staff through regional management to store management, if possible.
The ability to view results on-line can take many forms. In its simplest form it can act as an efficient way to disseminate information. We have the ability to allow corporate staff to view store reports and approve them for e-mail distribution.
Reporting web sites are fully branded for each client, and are often incorporated into their company Intranet. Examples of some of what can be delivered are on the following pages.
Home Page
The home page allows quick access to various levels of reporting, as well as containing information about the program. Descriptions of the methodology, access to the questionnaires, which to contact, FAQ’s, and other information can all be accessed from this page.
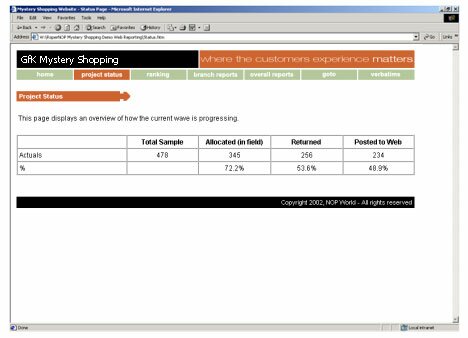
Project Status
Project Status provides management with an overview of the progress of each wave in the field.
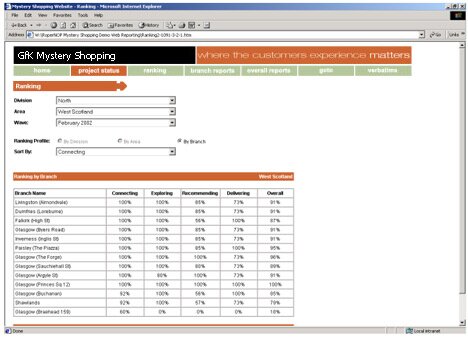
Ranking
Provides the user with a Ranking of location at various levels of hierarchy (e.g., store level, divisional, regional). Locations can be sorted by levels of hierarchy, time periods, or questionnaire sections.
Tabulation Reports
Tabulation reports allow managers to quickly compare questionnaire results, down to the question level, across levels of hierarchy.
Trending reports
Trending reports allow managers to quickly review the progress at any level of hierarchy over time, against comparable results for other levels of hierarchy. For example, a local district manager can see how her district has done over the past six shops, and compare that trend against the region her district belongs to as well as national results.
Summary Reports
Summary reports provide a comparison of all results within a particular time period at a given level of hierarchy. The screen below shows the results for all stores in a District for a recent wave of shops, including the score for the District as a whole.
Verbatims or Narrative
This tool is available to view any open-end comments that are gathered during a shop. They can be viewed by question and, like all other reports, can be filtered by time period and level of hierarchy.
Additional Web Features
One way of ensuring that results will be acted upon is to build action planning into the web site. This can prompt store managers to produce an electronic action plan for any area where they have not achieved an acceptable standard. These action plans can then be viewed and signed off by the store’s area manager. Managing this system on-line allows for e-mail tracking of actions and exceptions reporting to named contacts, if actions are not being followed up.
Other features can include an on-line appeals procedure, detailed analysis of results, web chats with key individuals involved in the program and chat rooms where staff can share information. Executive summaries and presentations can also be made available through the site.
There is no limit to how far a website can expand. By adding new features on an ongoing basis, staff will be encouraged to keep coming back and using the system.
Ad hoc Data Requests
GfK Mystery Shopping’s data management systems allow for easy and efficient access to live results, so most requests can be handled quickly and without incurring additional costs.
back to top
|